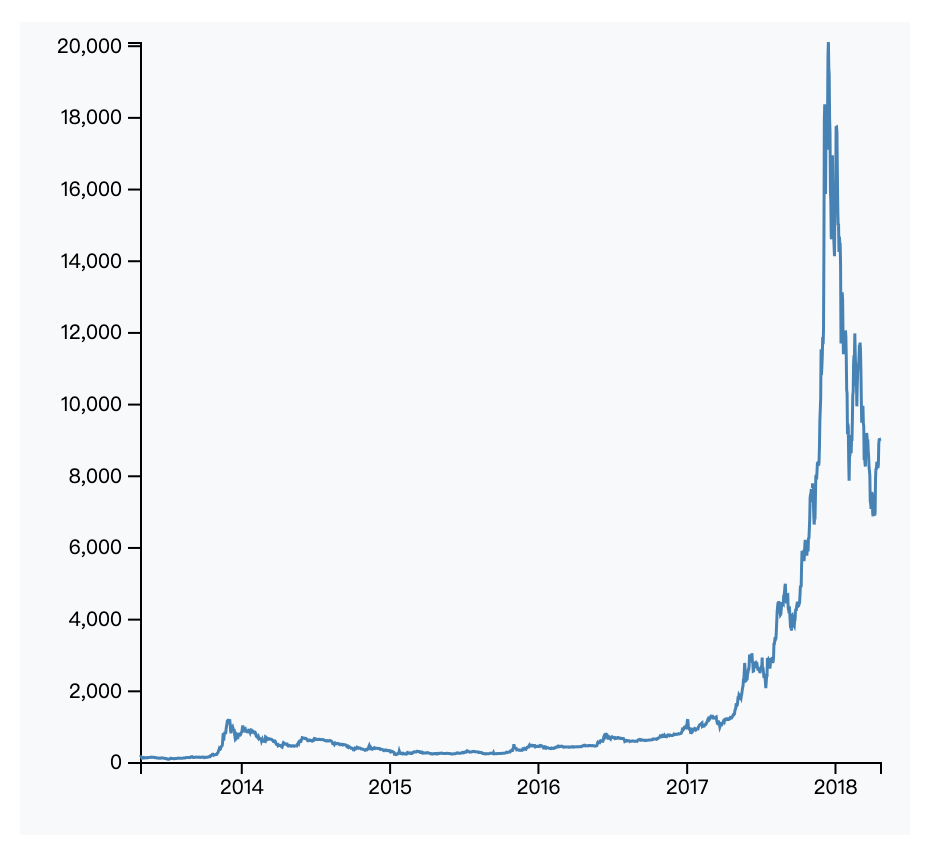
The x-axis data is too dense. How to configure it to ignore part of the display content?
Question Description
I am drawing a line chart with a large amount of data. The data contains many dimensions. If it is drawn through d3, axisBottom will omit part of the content and only display a few dimension items. I hope to be able to display a large number of tags relatively densely without the tags being blocked. Is there any tool that can achieve this ?
The demo line chart result of D3 is as follows:d3

Solution
VChart allows developers to configure different axis label display strategies. By default, VChart will sample axis labels to display appropriate label content. Developers can configure axes.sampling to false to turn off this sampling algorithm, and apply the label occlusion algorithm through axes.label.autoRotate to display more labels while avoiding occlusion. Developers can also turn on the automatic rotation of labels through axes.label.autoHide to display more label content.
In addition, if developers are still not satisfied with these built-in label display strategies, they can customize the label display rules through axes.label.dataFilter:
